Image segmentation is a method in which a digital image is broken into various subgroups called image segments, which help reduce the complexity of the image to make processing or analysis of the image simpler. In other words, segmentation involves assigning labels to pixels. All picture elements or pixels belonging to the same category have a common label assigned to them.
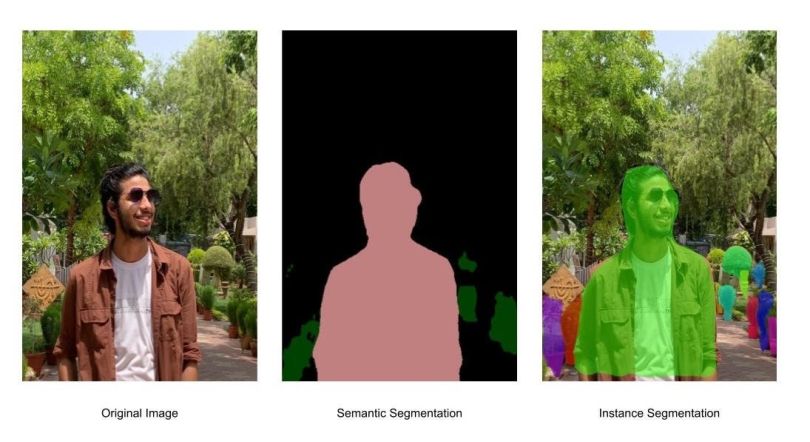
For example, let’s look at a problem where the picture has to be provided as input for object detection. Rather than processing the whole image, the detector can be inputted with a region selected by a segmentation algorithm. This will prevent the detector from processing the whole image thereby reducing inference time.

Approaches in Image Segmentation
There are two common approaches in image segmentation:
- Similarity approach: This approach involves detecting similarity between image pixels to form a segment based on a given threshold. Machine learning algorithms like clustering are based on this type of approach to segment an image.
- Discontinuity approach: This approach relies on the discontinuity of pixel intensity values of the image. Line, point and edge detection techniques use this type of approach for obtaining intermediate segmentation results that can later be processed to obtain the final segmented image.
Image Segmentation Techniques
There are five common image segmentation techniques.
5 Image Segmentation Techniques to Know
- Threshold-based segmentation
- Edge-based image segmentation
- Region-based image segmentation
- Clustering-based image segmentation
- Artificial neural network-based segmentation
In this article, we will cover threshold-based, edge-based, region-based and clustering-based image segmentation techniques.
Threshold-Based Image Segmentation
Image thresholding segmentation is a simple form of image segmentation. It’s a way of creating a binary or multi-color image based on setting a threshold value on the pixel intensity of the original image.
In this thresholding process, we will consider the intensity histogram of all the pixels in the image. Then we will set a threshold to divide the image into sections. For example, consider image pixels ranging from 0 to 255, we’ll set a threshold of 60. So, all the pixels with values less than or equal to 60 will be provided with a value of 0 (black), and all the pixels with a value greater than 60 will be provided with a value of 255 (white).
Consider an image with a background and an object, we can divide an image into regions based on the intensity of the object and the background. But this threshold has to be perfectly set to segment an image into an object and a background.
Various thresholding techniques include:
1. Global Thresholding
In this method, we use a bimodal image. A bimodal image is an image with two peaks of intensities in the intensity distribution plot. One for the object and one for the background. Then, we deduce the threshold value for the entire image and use that global threshold for the whole image. A disadvantage of this type of threshold is that it performs really poorly when there’s poor illumination in the image.
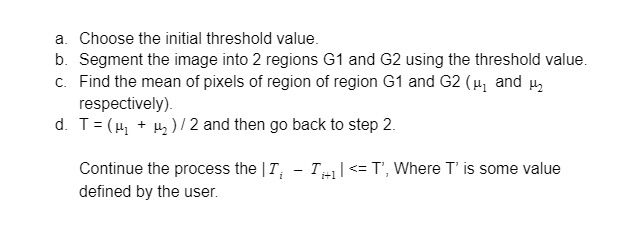
2. Manual Thresholding
The following process goes as follows:
3. Adaptive Thresholding
To overcome the effect of illumination, the image is divided into various subregions, and each region is segmented using the threshold value calculated for all of them. Then these subregions are combined to image the complete segmented image. This helps reduce the effect of illumination to a certain extent.
4. Optimal Thresholding
Optimal thresholding technique can be used to minimize the misclassification of pixels performed by segmentation.
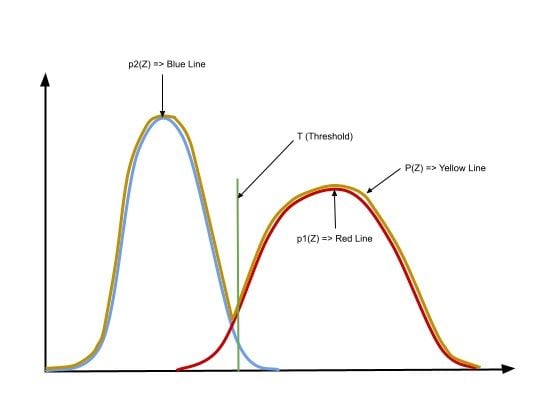
Calculation of an optimal threshold uses an iterative method by minimizing the misclassification loss of a pixel.
The probability of a pixel value is given by the following formulas :


We consider a threshold value T as the initial threshold value. If the pixel value of the pixel to be determined is less or equal to T, then it belongs to the background, else it belongs to the object.


E1: Error if a background pixel is misclassified as an object pixel.

E2: Error if an object pixel is misclassified as a background pixel.

E(T): Total error in the classification of pixels as background or object. To obtain great segmentation, we have to minimize this error. We do so by taking the derivative of the following equation and equating it to zero.

Consider a gaussian pixel density, the value of P(Z) can be calculated as:


After this, the new value of T can be calculated by inputting it into the following equation:


5. Local Adaptive Thresholding
Due to a variation in the illumination of pixels in the image, global thresholding might have difficulty in segmenting the image. Hence, the image is divided into smaller subgroups and then adaptive thresholding of those individual groups is conducted. After completing the individual segmentation of these subgroups, all of them are combined to form the completed segmented image of the original image. Hence, the histogram of subgroups helps in providing better segmentation of the image.
Practical Implementation of Thresholding-Based Segmentation
Importing libraries

import numpy as np
import cv2
import matplotlib.pyplot as plt
import seaborn as sns
import warnings


warnings.filterwarnings("ignore")


image = cv2.imread("/content/1.jpg", 0)


plt.figure(figsize=(8, 8))
plt.imshow(image, cmap="gray")
plt.axis("off")
plt.show()


flattened_image = image.reshape((image.shape[0] * image.shape[1],))


flattened_image.shape

(6553600,)
PDF of image intensities

plt.figure()
sns.distplot(flattened_image, kde=True)
plt.show()


Applying Otsu Thresholding to the image for segmentation

ret, thresh1 = cv2.threshold(image, 0, 255, cv2.THRESH_BINARY + cv2.THRESH_OTSU)


plt.figure(figsize=(8, 8))
plt.imshow(thresh1, cmap="binary")
plt.axis("off")
plt.show()
Edge-Based Image Segmentation
Edge-based segmentation relies on edges found in an image using various edge detection operators. These edges mark image locations of discontinuity in gray levels, color, texture, etc. When we move from one region to another, the gray level may change. So, if we can find that discontinuity, we can find that edge. A variety of edge detection operators are available, but the resulting image is an intermediate segmentation result and should not be confused with the final segmented image. We have to perform further processing on the image to segment it.
Additional steps include combining edges segments obtained into one segment in order to reduce the number of segments rather than chunks of small borders which might hinder the process of region filling. This is done to obtain a seamless border of the object. The goal of edge segmentation is to get an intermediate segmentation result to which we can apply region-based or any other type of segmentation to get the final segmented image.
Types of Edges
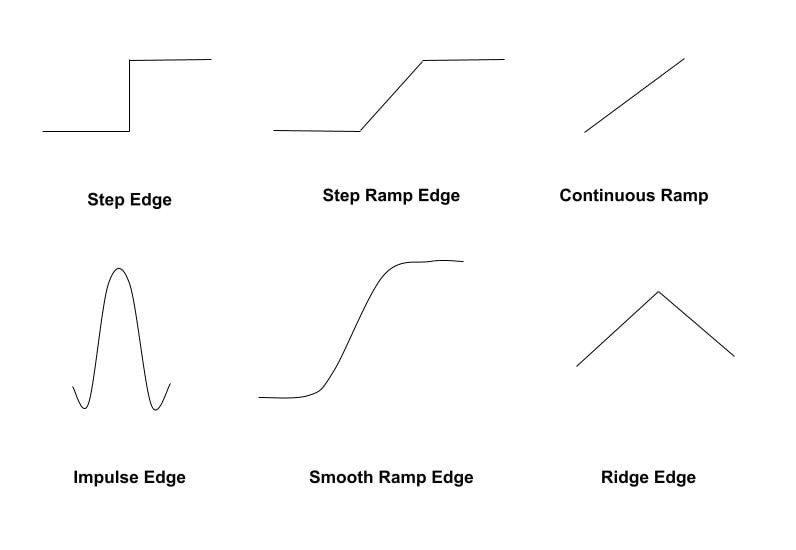
Edges are usually associated with magnitude and direction. Some edge detectors give both directions and magnitude. We can use various edge detectors like the Sobel edge operator, canny edge detector, Kirsch edge operator, Prewitt edge operator and Robert’s edge operator, etc.
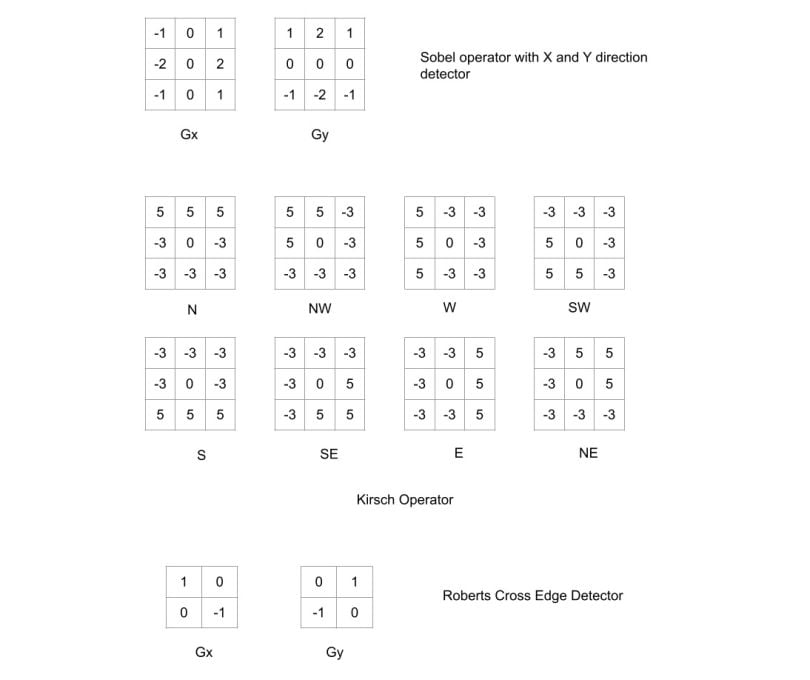
Any of the three formulas can be used to calculate the value of g. After calculation of g and theta, we obtain the edge vector, with both magnitudes as well as direction.


Practical Implementation of Edge-Based Segmentation
Importing Library

import numpy as np
import cv2
import matplotlib.pyplot as plt
import seaborn as sns
import warnings
from skimage import filters
import skimage


warnings.filterwarnings("ignore")


image = cv2.imread("/content/1.jpg", 0)


plt.figure(figsize=(8, 8))
plt.imshow(image)
plt.axis("off")
plt.show()


Applying Sobel Edge operator

sobel_image = filters.sobel(image)


# cmap while displaying is not changed to gray for better visualisation
plt.figure(figsize=(8, 8))
plt.imshow(sobel_image)
plt.axis("off")
plt.show()


Applying Roberts Edge operator

roberts_image = filters.roberts(image)


# cmap while displaying is not changed to gray for better visualisation
plt.figure(figsize=(8, 8))
plt.imshow(roberts_image)
plt.axis("off")
plt.show()


Applying Prewitt edge operator

prewitt_image = filters.prewitt(image)


# cmap while displaying is not changed to gray for better visualisation
plt.figure(figsize=(8, 8))
plt.imshow(prewitt_image)
plt.axis("off")
plt.show()
Region-Based Image Segmentation
A region can be classified as a group of connected pixels exhibiting similar properties. Pixel similarity can be in terms of intensity and color, etc. In this type of segmentation, some predefined rules are present that pixels have to obey in order to be classified into similar pixel regions. Region-based segmentation methods are preferred over edge-based segmentation methods if it’s a noisy image. Region-based techniques are further classified into two types based on the approaches they follow:
- Region growing method.
- Region splitting and merging method.
Region Growing Technique
With the region growing method, we start with a pixel as the seed pixel, and then check the adjacent pixels. If the adjacent pixels abide by the predefined rules, then that pixel is added to the region of the seed pixel and the following process continues till there is no similarity left.
This method follows the bottom-up approach. If a region is growing, the preferred rule can be set as a threshold. For example, consider a seed pixel of two in the given image and a threshold value of three. If a pixel has a value greater than three, then it will be considered inside the seed pixel region. Otherwise, it will be considered in another region. As a result, two regions are formed in the following image based on a threshold value of three.

Region Splitting and Merging Technique
In region splitting, the whole image is first taken as a single region. If the region does not follow the predefined rules, then it is divided into multiple regions (usually four quadrants), and then the pre-defined rules are carried out on those regions in order to decide whether to further subdivide or to classify that as a region. The following process continues until every region follows the pre-defined rules.
In the region merging technique, we consider every pixel as an individual region. We select a region as the seed region to check if adjacent regions are similar based on our predefined rules. If they are similar, we merge them into a single region and move ahead in order to build the segmented regions of the whole image. Both region splitting and region merging are iterative processes. Usually, the first region splitting is done on an image so as to split an image into maximum regions, and then these regions are merged in order to form a good segmented image of the original image.
In region splitting, the following condition can be checked in order to determine whether to subdivide a region or not. If the absolute value of the difference of the maximum and minimum pixel intensities in a region is less than or equal to a threshold value decided by the user, then the region does not require further splitting.


Clustering-Based Segmentation
Clustering is a type of unsupervised machine learning algorithm. It’s often used for image segmentation. One of the most dominant clustering-based algorithms used for segmentation is K-means clustering. This type of clustering can be used to make segments in a colored image.
K-Means Clustering
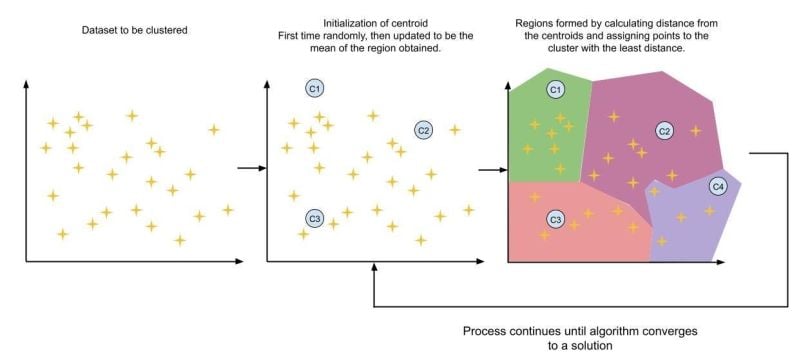
Let’s imagine a two-dimensional dataset for better visualization.
First, in the data set, centroids (chosen by the user) are randomly initialized. Then the distance of all the points to all the clusters is calculated and the point is assigned to the cluster with the least distance. Then centroids of all the clusters are recalculated by taking the mean of that cluster as the centroid. Then data points are assigned to those clusters. And the process continues until the algorithm converges to a good solution. Usually, the algorithm takes a very small number of iterations to converge to a solution and does not bounce.
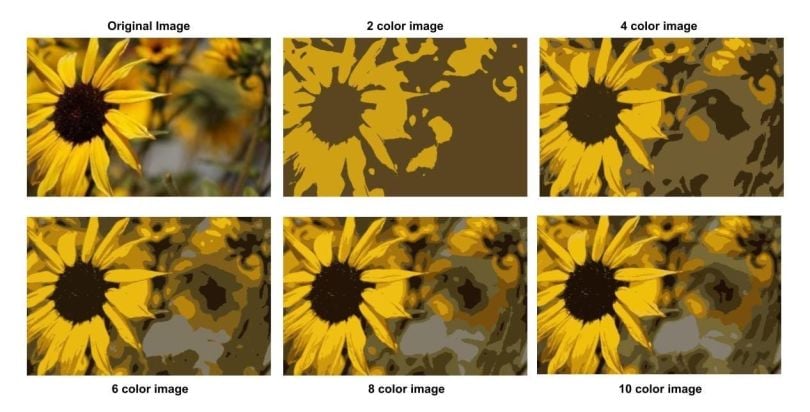
I hope that you find this article and explanation useful.


